ECU Remap
This is undoubtedly the key element for this development phase and where most of the time has been spent.
The RS3 uses the Bosch MED 17.1.x ECU family…… without going into a massive amount of detail, this ECU is one very powerful mofo. The amount of control it can have over how the engine performs is pretty mind blowing. The art of making the car “sing”, utilising/modifying the appropriate calibrations (there are well over 100,000 of these!) and ensuring you’re not hitting the protection tables (ultimately resulting in power being pulled down), is where the time and effort is needed.
It goes without saying that even from a pure technical and in essence, logical standpoint, a properly mapped ECU should be overall, far better than a tuning box (convenience to one side).
One of the plus sides of mapping the MED 17.1.x is the fact that this can be accessed fully via the OBD port. I don’t personally know if all current tuners are using this method, I suspect they are to be honest. The other method (as is the case with the A45) is via a method known as BDM. The process to achieve this is commonly referred to as a “bench tune”, which effectively means the ECU is pulled out of the car and programmed. This also makes tuning a bit of a time consuming effort, assuming you need to alter and test different calibration adjustments. It means you program the ECU (out of the car and you normally open it up); refit; log on road/dyno; pull ECU out and make adjustments and refit/log again - repeat until you get bored!
Fortunately the RS3 has OBD programming access.
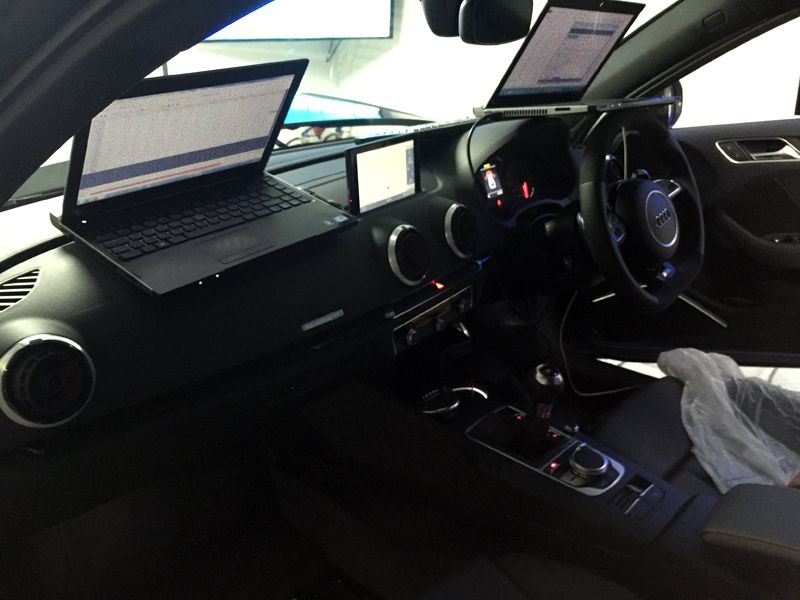
So how is the programming done - put simply a laptop with the programming software is connected to the ECU via the cars OBD port, and the new map file is written to the ECU…. all in situ. It takes around 10 minutes to reprogram the ECU with each new map file.
Enough screens for you?
TEST 2 - ECU Remap and Secondary Decats
Whilst I’m reporting this as TEST 2, there was a whole process that we went through to get to this point. This was certainly not the first map that was created (in fact it was the last one of the day), but was where we finished up at the end of this specific session. If memory serves me correctly we created at least 7 maps, each one altering a single area to see what the effect was, then rolling up the “good” changes with the next change. Basically taking an incremental approach.
Summary of Spec
MY16 RS3
Litchfield Stage 1 ECU calibration
Miltek Secondary Decat Pipes
Fuel - VPower Nitro (99 oct)
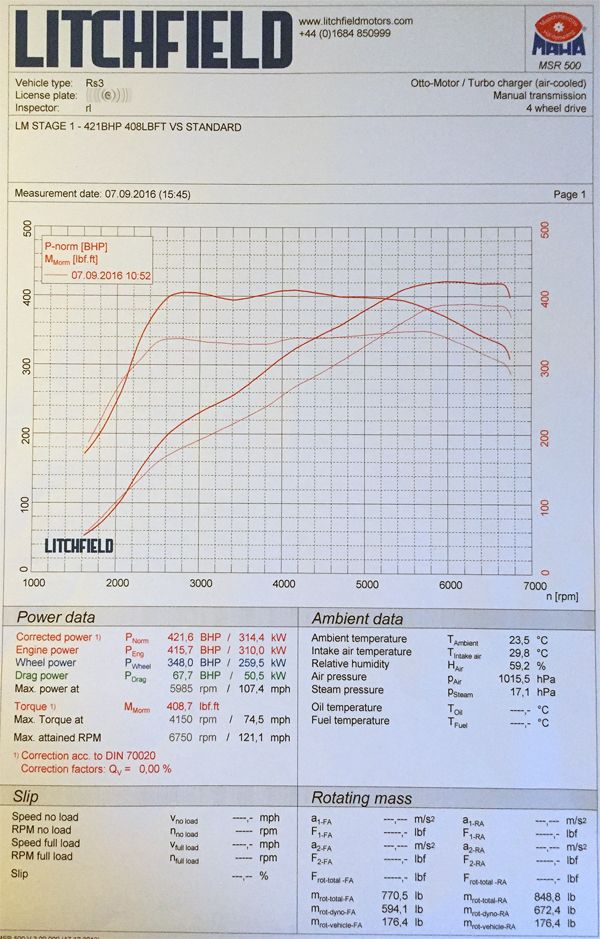
TEST 2 figure achieved was 421.6bhp & 408.7lbft @ flywheel
Comparing this against the stock figure (which is the comparison the graph above shows) we saw the following:
+33.6 bhp +58.7 lbft (peak) over stock
+8.6% bhp +16.7% lbft (peak) over stock
I’ve banged on about this before (probably), but in my experience of using most makes of dynos in the UK over the years, I have always found MAHA dynos to provide quite a stingy torque figure…. Certainly in comparison to other dyno makes. So it’s worth bearing this in mind when you compare figures. Which is seen here with the stock figures as much as the tuned figures in my opinion. But it is what it is.
TEST 2 - Comments
I certainly know I’ve said this before, but one thing that is very important in my opinion, is to not just focus on peak power figures. You really need to look at the whole rev range and thus the whole area UNDER the curve to appreciate improvements.
Considering this was after the initial mapping session, and whilst the peak figures attained are good, there are higher improvements being seen in the mid range.
Looking at the graph you can see that whilst torque is by and large a nice increase throughout the mid range by around +60lbft, the power is seeing increases through the mid range of +50 bhp.
To me, for a road car, it’s about torque and mid range grunt.
TEST 2 - Road
Yeah….. That’s different!
I’ve always thought the stock RS3 was already quick, which is in part down to it’s power delivery and smoothness. This map just amplified the stock delivery, whilst retaining the stock characteristics. This map almost felt too smooth though, however, smooth delivery can mean in reality a quick car!
The car was certainly more urgent in the mid range (increased torque) and felt like it was pulling harder at the top end.
Being honest I suppose I was expecting more. Don’t know why though. Although expectation is normally high when going through a tuning process, but let’s be honest, this map was far from finished. So I needed to put things into perspective.
It felt good and quicker, but just didn’t blow my socks off. But then will Stage 1 ever do that. We’re all greedy aren't we!
The noise……
Initially I didn’t think there was much of a difference on the road, but when you start driving a bit more, you really do notice the bigger growl. Because the RS3 switches the exhaust flaps dependant on throttle, it is more or less as before until you open it up….. Then it really does sounds awesome. Something I have noticed is perhaps a very slight drone now at cruise 70-80mph. It’s only very slight and I can’t say I noticed it before. It’s certainly a great and cheap mod to make in my opinion. These engines sound awesome…. These decat pipes just makes it sound that much more awesome!
It was agreed to carry on with the mapping development in a couple of days time.
TEST 3 - Revised ECU Remap and Secondary Decats
So, the second session of mapping commenced. First off we took a Day 2 baseline run just to ensure that we were still where we left off on the previous session. This run was within a couple of BHP of where we were at the end of Day 1 (as per TEST 2), so we were good to go.
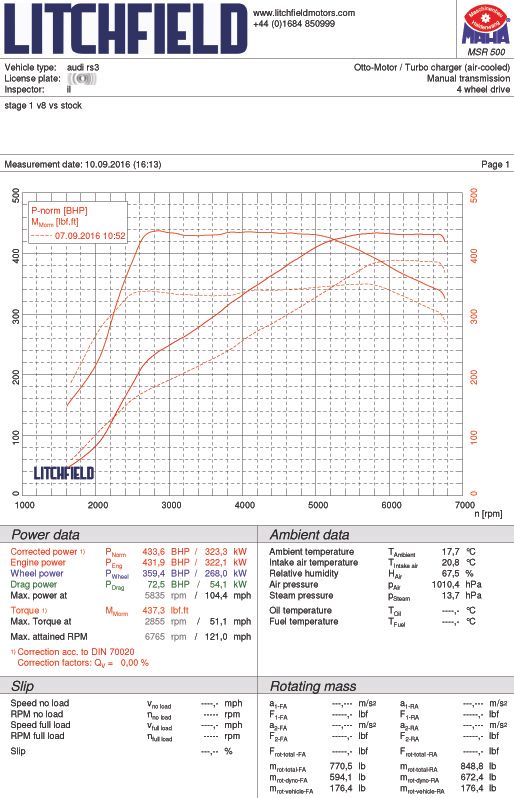
Again, just to go through the process we followed…. On Day 2 we took the map (currently on the car) from the end of Day 1 and called that Stage 1 v1. During this session we went through a similar task as the previous session, carrying on where we left off. During this session we created 9 new maps, although the last revision didn’t make any positive difference so we reverted back to the v8 map from this session. Litchfield’s had already created 6 new maps prior, and we created 3 additional new ones on the day (using what was learnt during this specific session).
We were on the dyno for around 4 hours for this session.
Summary of Spec
MY16 RS3
Litchfield Stage 1 ECU calibration
Miltek Secondary Decat Pipes
Fuel - VPower Nitro (99 oct)
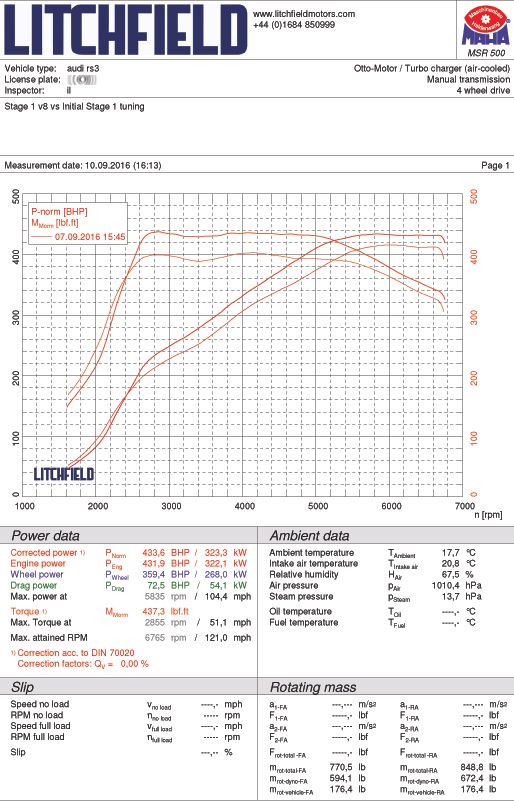
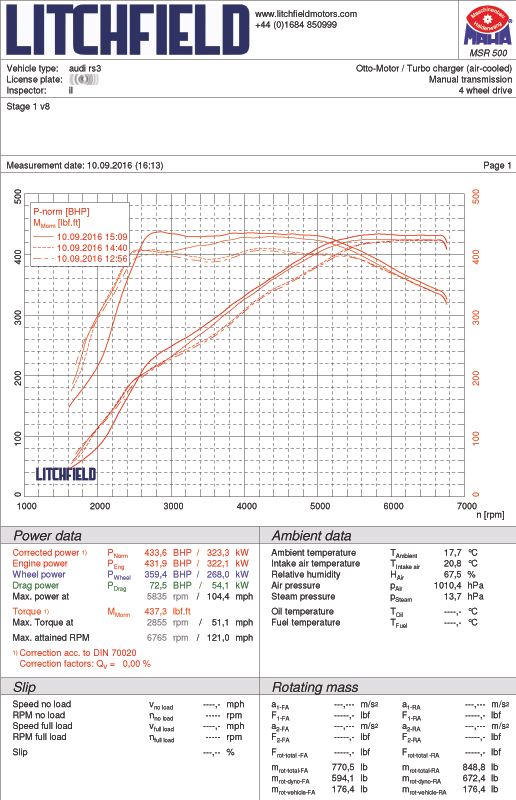
TEST 3 figure achieved was 433.6bhp & 437.3lbft @ flywheel
Comparing this against TEST 2 figure (which is the comparison the graph above shows) we saw the following:
+12.0 bhp +28.6 lbft (peak) over TEST 2
+2.8% bhp +6.9% lbft (peak) over TEST 2
Overall Stage 1 Test 3 comparison against stock
+45.6 bhp +87.3 lbft (peak)
+11.7% bhp +24.9% lbft (peak)
TEST 3 - Comments
Obviously at this stage all I had to go by was the dyno data (and logs), but if you appreciate what a “good” road car dyno graph can look like, this is one of them in my opinion.
Two things to point out initially about the graph. One being the way the car was loaded up for this run. This is highlighted by the initial shape of the torque and power curve up to around 2150rpm. This isn’t a mapping issue which has caused this, this is purely because the car was not loaded on the dyno from a low enough rpm. It’s just the way this one was run (mistake by the dyno operator). It’s only that initial part of the run that was affected.
The second point (and I’m being really nit picking / anal here) is the very very slight dip (it’s probably in the region of 6lbft) in torque from 3-3800rpm. That is also replicated in the power curve for the same rpm. This is due to a very minor but further adjustment being needed to the boost control, as it looks like the ECU thinks it’s going to overboost just as it reaches initial peak boost, so it pulls back the boost slightly and then increases the boost again.
These two minor things to one side, this is such a smooth curve. The torque is virtually flat decked throughout the mid range. The power curve also looks so linear up to peak power, and then manages to hold that peak (virtually) through to the limiter.
If you compare the stock torque curve through the mid range, and even the torque curve result as part of the first mapping session, you will see that there is so much more control now in this area on this version of the map.
Even without getting the car on the road (which we did when we were happy with map, just to double check the logs on the black stuff), the curves alluded to a very nice driveable map.
As before let’s look at what increases have been seen through the mid range…..
In parts we’re talking +100 lbft and on average +90 lbft. With the BHP you’re seeing +80 bhp through a large amount of the same mid range. Those are some significant increases!
Due to time cracking on it was decided to call it a day….. For now.
For further context here is a dyno comparison of just a sample of the maps tested during this recent session. I won’t go into boring detail but you can see differences in the runs which were the outcome of the different maps. This was all part of the testing / learning process to end up with the final result.
TEST 3 - Road
Being honest I really wasn’t expecting much of a change on the road from the previous session map outcome. Perhaps I’d just desensitised myself. Lol
I fully appreciate this will be so subjective, but I thought I would just share the feedback I provided back to Iain after I go home. This is straight up and honest feedback, that was certainly never intended to be made public. But since this is what I felt / feel, I thought I would share.
“It's jeffing awesome mate.
I've never seen the traction control light coming on so much!!!! lol
I was genuinely laughing and smiling on the way home.
It's feels like a totally different car since Wednesday's map, which I wasn't expecting.
Whilst it's still very smooth and the gearbox just sucks everything up you give it, the way the power comes in (urgency and magnitude) on a low rpm pull is fantastic. With the A45 it felt you had to properly wind it up (they are pretty much at the same peak figure level now). With this though, it's much more responsive and instant.
You can feel a big improvement both in the midrange and top end since Wednesday. It feels quite exciting when you keep your foot in, which it didn't on Wednesday. Mid range feels very smooth.... but it feels like it's pulling so hard.
Top end feels like it's giving measurable improvements over Wednesday.
I look forward to your further map tweaks!!!! Get mashing that keyboard!!!!”
To be honest I’m not going to add anything else. I could keep banging on about how it feels etc but there is little point wasting bandwidth! lol
For me that’s Stage 1 done and dusted.
I intend to get down the quarter mile again this weekend and also carry out some VBOX logging. As and when I get these performance measures I’ll update this thread. It will be interesting to see where the car is in relation to my stock performance data.
Stage 2 will begin in a couple of weeks…. So expect more news on that very soon!


 Sign In
 Create Account


 Back to top
 Quote
Quote MultiQuote


